
What is Simpson’s Paradox?
Simpson’s paradox, also known as the amalgamation paradox, reversal paradox, or Yule-Simpson effect, is a paradox in which a statistical trend appears to be present when data are segmented into separate groups of data but disappears (or reverses) when the data is considered as a whole. Simpson’s paradox can arise when causal relations are ignored, but disappears when they are properly accounted for.[1]
Let us walk through an example
The Data
Here we will use the kidney stone treatment(T) dataset from Wikipedia[2]. The table below shows the success rates and numbers of treatments(T) for treatments involving both small and large kidney stones, where Treatment A(takes longer for execution) includes open surgical procedures and Treatment B(takes less time for execution) includes closed surgical procedures. The numbers in parentheses indicate the number of success cases over the total size of the group.
Here, we will generalize the data feature names as follows:
- The treatment given will be referred as “T” {Treatment A -> 0; Treatment B -> 1}
- Size of the stone is the medical condition so here we will denote it as “C” {Small -> 0; Large -> 1}
- The result of the treatment i.e. the outcome will be referred as “Y”
This is an observational study and not a clinical trial.
First, we will see the undivided total data and see which treatment is most effective.
| Total | |
|---|---|
| Treatment A | 78% (273/350) |
| Treatment B | 83% (289/350) |
As we can see Treatment B is most effective as per the above table. Now, we have another parameter i.e. Size of the Stone will refer as Condition (C) throughout the post.
| Treatment(T)/Size(C) | Small(0) | Large(1) | Total |
|---|---|---|---|
| Treatment A | 93% (81/87) | 73% (192/263) | 78% (273/350) |
| Treatment B | 87% (234/270) | 69% (55/80) | 83% (289/350) |
| $E[Y|T,S=0]$ | $E[Y|T,S=1]$ | $E[Y|T]$ |
Now we see the paradox. When we see just the total Treatment B is more effective compared to Treatment A. But when we use another parameter to subgroup the total data then we see the Treatment A is more effective than Treatment B. So, the effectiveness got reversed when we divided in to subgroups.
The Problem Statement
Which treatment will be the most beneficial for the all the patients?
Disclaimer: The post might not be medically accurate and the dataset used here is only for explanation.
The Solution
The answer is not that straight forward and it largely depends on the causal structure of the problem.
Causal Inference is inferring the effect of one thing on another thing. Simply, we can state: “Effect of X on Y”.
Here we will construct different causal graphs for the problem statement.
Scenario 1
Here the causal graph is the “Condition(C)” is a cause of the “Treatment(T)” and also the treatment and condition is the cause of the “Outcome(Y)”. Here the important part is that: "C" is the cause of the "T".
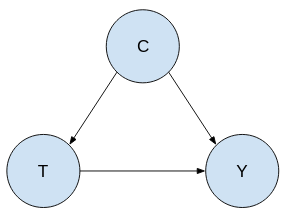
In the first scenario Treatment A will be better choice.
Example:
Say, the doctor sees a patient come in as a small stone so the doctor in most of the cases will decide to assign them “Treatment B” and they will save the “Treatment A” for more large stone conditions. This is the reason we see among patients who have small stone, 270 patients out of 357 are assigned “Treatment B”.
Similarly, If someone comes with a large stone the doctor will most likely prescribe “Treatment A” as it is worth it to give “Treatment A”. That is why we see for patients with large stone 263 out of 343 were assigned “Treatment A”.
So, in this scenario “Treatment A” is preferred because the reason we are getting only 78% is mainly because “Treatment A” is disproportionately assigned to to patients with large stones who has less success rate. Similarly “Treatment B” is disproportionately assigned to smaller stone who has higher success rate.
In this case the correct numbers to look at are the sub group numbers so “Treatment A” is preferred in this case when we have condition as a cause of treatment.
Scenario 2
In scenario 2 the causal graph is the “Treatment(T)” is a cause of the “Condition(C)” and also the treatment and condition is the cause of the “Outcome(Y)”. The main difference from scenario 1 that: "T" is the cause of the "C".
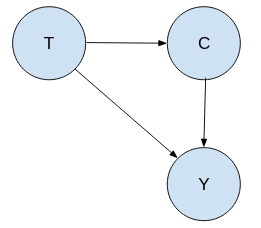
In the second scenario Treatment B will be better choice.
Example:
Say, patients are prescribed “Treatment A” and they have to wait for a long time to take “Treatment B” as it is a open surgical procedure. In that waiting time the condition can worsen. If someone comes in with a small stone and due to this waiting, it can worsen. That is the reason we see that among people who were prescribed “Treatment A” 263 out of 350. It could have been that many of them transitioned from the small kidney stone group to large kidney stone condition.
Now, If we are assigned “Treatment B” as it is faster unlike treatment A. So we do not have to wait at all and someone comes in with a small stone and it is highly likely the patient will still have a small kidney stone at the time of treatment B. That is the reason we see out of 350 patients assigned “Treatment B”, 270 of them had small kidney stone and, 80 that have large stone are probably not transitioned from the small stone due to waiting. Most probably these patients came in with severe condition.
So, the reason we prefer “Treatment B” for scenario 2 because the treatment is actually causing the patients to have worst condition if “Treatment A” is given. But if someone is given treatment B it is causing to have the same condition.
The treatment has a effect on the patients condition which then has a effect on the success rate. There is an effect going through the Condition(C) from Treatment(T) to Outcome(Y) which we have to take in to account. The way we can take this in account is to look at the total numbers.
References
- https://mathworld.wolfram.com/SimpsonsParadox.html
- https://en.wikipedia.org/wiki/Simpson%27s_paradox
- https://www.bmj.com/content/309/6967/1480.full
- https://www.sciencedirect.com/topics/mathematics/causal-structure
- https://analyticsindiamag.com/understanding-simpsons-paradox-and-its-impact-on-data-analytics/